Real-Time ECG QRS Detection
This example shows how to detect the QRS complex of an electrocardiogram (ECG) signal in real time. The example uses Model-Based design to develop, test, deploy the algorithm.
Introduction
An ECG is a recording of body surface potentials generated by the electrical activity of the heart. Clinicians can evaluate an individual's cardiac condition and overall health from the ECG recording and perform further diagnosis.
A normal ECG waveform is illustrated in figure [1]. Because of the physiological variability of the QRS complex and various types of noise present in the real ECG signal, it is challenging to accurately detect the QRS complex.
The noise sources that corrupt raw ECG signals include:
Baseline wander
Power line interference (50 Hz or 60 Hz)
Electromyographic (EMG) or muscle noise
Artifacts due to electrode motion
Electrode contact noise

ECG Signal Source
The ECG signals used in the development and testing of the biomedical signal processing algorithms are mainly from three sources: 1) Biomedical databases (for example, MIT-BIH Arrhythmia Database) or other prerecorded ECG data; 2) ECG simulator; 3) Real-time ECG data acquisition.
This example uses the following prerecorded and simulated ECG signals. All signals in this example have a sampling frequency of 360Hz.
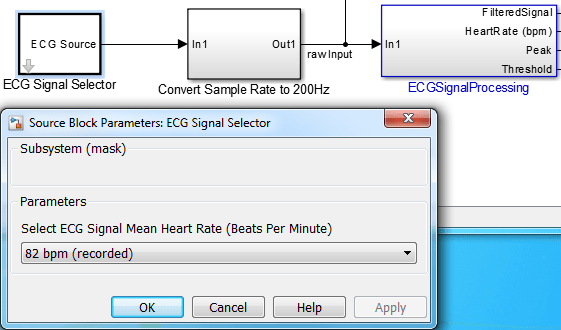
One set of recorded real ECG data sampled from a healthy volunteer with a mean heart rate of 82 beats per minute (bpm). This ECG data was prefiltered and amplified by the analog front-end application before being fed to the 12-bit ADC.
Four sets of synthesized ECG signals with different mean heart rates ranging from 45 bpm to 220 bpm. This example uses ECGSYN to generate synthetic ECG signals in MATLAB using the following characteristics:
Sampling frequency: 360 Hz
Additive uniformly distributed measurement noise: 0.005 mV
Standard deviation of heart rate : 1 bpm
The figure below shows the dialog box for the ECG Signal Selector block in which you can select the ECG signal from the five options mentioned above.
ECG Signal Preprocessing and Filtering
This example uses a real-time QRS detection algorithm, which references [1, lab one], [3] and [4], developed in Simulink with the assumption that the sampling frequency of the input ECG signal is always 200 Hz (or 200 samples/s). However, the recorded real ECG data can have different sampling frequencies ranging from 200 Hz to 1000 Hz, for example, 360 Hz as in this example. To bridge the different sampling frequencies, the model in this example uses a sample-rate converter block to convert the sample rate to 200 Hz. It also uses a buffer block to ensure that the length of the input ECG signal is a multiple of the decimation factor calculated by the sample-rate converter block.
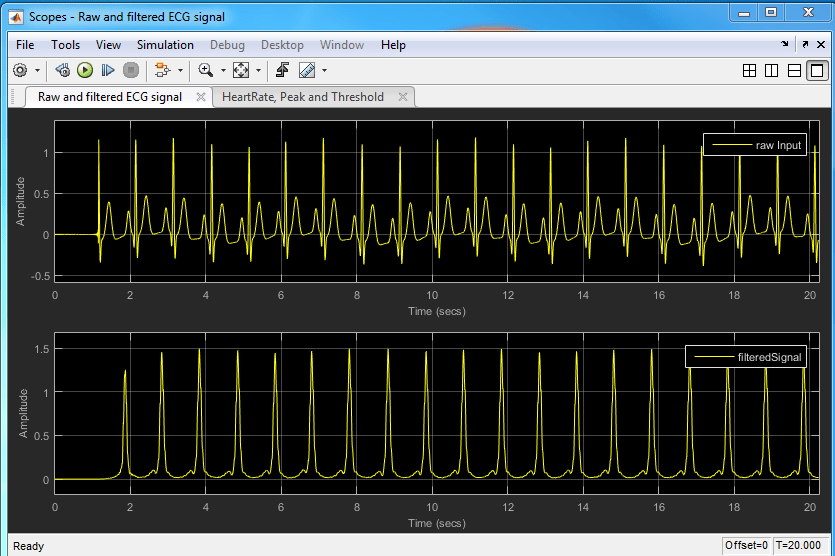
The ECG signal is filtered to generate a windowed estimate of the energy in the QRS frequency band. The filtering operation has these steps:
1. Design an FIR Bandpass filter with a passband from 5 to 26 Hz.
2. Calculate the derivative of the bandpass filtered signal.
3. Calculate the absolute value of the signal.
4. Average the absolute value over an 80-ms window.

Real-Time QRS Detection of ECG Signal
The QRS detection block detects peaks of the filtered ECG signal in real time. It automatically adjusts the detection threshold based on the mean estimate of the average QRS peak and the average noise peak. The block then classifies the detected peak as a QRS complex or as noise, depending on whether the peak value is above the threshold.
The following QRS detection rules reference the PIC-based QRS detector implemented in [4].
Rule 1. Ignore all peaks that precede or follow larger peaks by less than 196 ms (306 bpm).
Rule 2. If a peak occurs, check whether the raw signal contains both positive and negative slopes. If true, report a peak, otherwise, the peak represents a baseline shift.
Rule 3. If the peak is larger than the detection threshold, classify it as a QRS complex. Otherwise classify it as noise.
Rule 4. If no QRS was detected within 1.5 R-to-R intervals, but a peak larger than half the detection threshold has been detected, and that peak followed the preceding detection by at least 360 ms, classify that peak as a QRS complex.
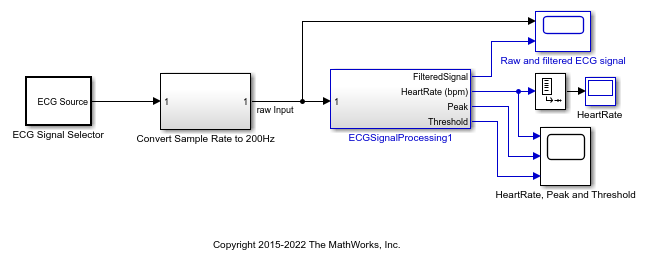
Simulate and Deploy
1. Open the ex_ecg_sigprocessing.slx model.
2. Change your current folder in MATLAB® to a writable folder.
3. On the model toolstrip, click Run to start the simulation. View the heart rate and the raw and filtered signal in the scope. You can also view the peak updates and the threshold and estimated mean heart rate in the scope.
4. Open the dialog box of the ECG Signal Selector block. Select the ECG signal mean heart rate in the drop-down menu. Click Apply and observe the real-time detection results in the scopes and HeartRate display.
5. Click Stop to end simulation.
6. After selecting target hardware, you can generate code from the ECGSignalProcessing subsystem and deploy it to the target.

References
[4] J. Pan and W. Tompkins, A Real-Time QRS Detection Algorithm, IEEE Transactions on Biomedical Engineering, 32(3): 230-236, March 1985
[5] Patrick S. Hamilton, EP Limited: Open Source ECG Analysis Software, 2002