Multicore Execution of Interpolated FIR Filter Using Dataflow Domain
This example shows how to speed up execution of an interpolated FIR filter using dataflow as the execution domain of the root model in Simulink®. Specifying the execution domain as dataflow at the root model enables multicore analysis, simulation, and code generation for the entire model.
Many real-time audio and digital signal processing applications require filtering of a signal streaming at a high sampling rate. The computational power required grows exponentially as the input sample rate or the filter order increases. One way to optimize the filtering process is to break it into multiple stages, but process the input at the same rate. This example demonstrates how to use multicore processing in the context of an interpolated FIR filter to improve the simulation performance of the model and generate multicore code.
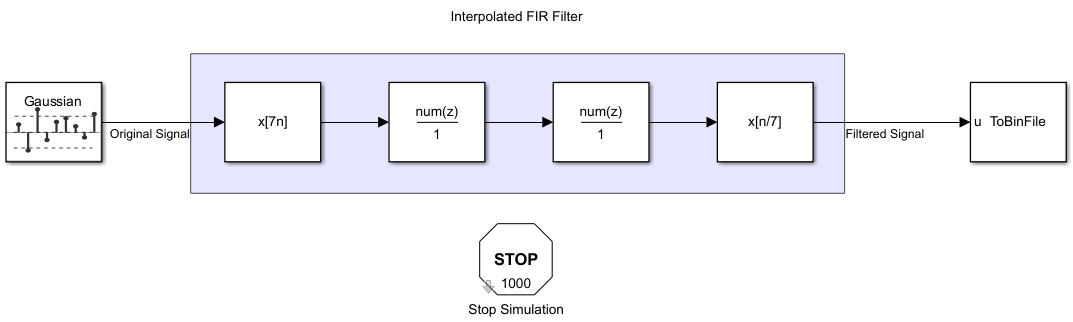
Open Interpolated FIR Filter Model
An interpolated FIR filter is an efficient alternative to a high-filter order FIR filter that uses an FIR decimator and an FIR interpolator to change the rate at which the input is filtered.
In this example, the input is a Gaussian pseudorandom distribution signal. The input first passes through an FIR Decimator block to lower the sampling rate and then is filtered by a set of Discrete FIR Filter blocks. The FIR Interpolator block then converts the sampling rate of the filtered output back to its original value. A MATLAB System block verifies the output data in code generation. A Stop Simulation block specifies the finite number of steps for which the simulation and generated code run. In this model, the number of steps is set to 1000 and each step processes one sample of size [7000 1].
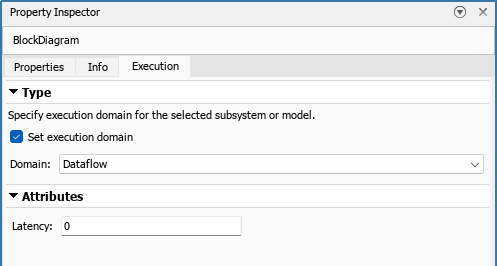
Specify Dataflow Execution Domain
In the Simulink, to specify dataflow as the execution domain for the root model:
In the Simulink Toolstrip, on the Modeling tab, in the Design gallery, select Property Inspector.
In the Property Inspector, click the Execution tab
Select Set domain specification.
Set Domain parameter to
Dataflow.
Enable Multicore Simulation
Dataflow domain automatically partitions your model into multiple threads for better performance. After you set the Domain parameter to Dataflow, you can use the Multicore tab in the Simulink toolstrip to analyze your model. To learn more about the Multicore tab, see Perform Multicore Analysis for Dataflow.
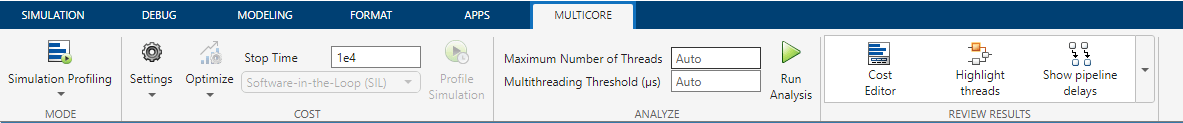
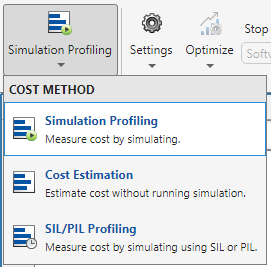
For this example, the mode is set to Simulation Profiling. This setting enables you to analyze the simulation performance.
To optimize the multicore settings and accept the optimization recommendations, in the Multicore tab, click Optimize. Alternatively, you can use the drop-down menu below the Optimize button to change the settings individually. In this example, the model settings have already been optimized for simulation performance.
Click the Run Analysis button to analyze the dataflow domain for simulation performance. After the analysis finishes, the Dataflow Analysis Report pane shows how many threads the dataflow system uses during simulation.
The Dataflow Analysis Report pane shows one thread because the data dependency between the blocks in the model prevents blocks from executing concurrently. By pipelining the data-dependent blocks, the dataflow system can increase concurrency for higher data throughput. The Dataflow Analysis Report pane shows the recommended number of pipeline delays under Suggested for Increasing Concurrency. The analysis estimates the latency value that results in the optimized simulation performance of this model.
This diagram shows the Dataflow Analysis Report pane, where the suggested latency is 4 for the dataflow system.
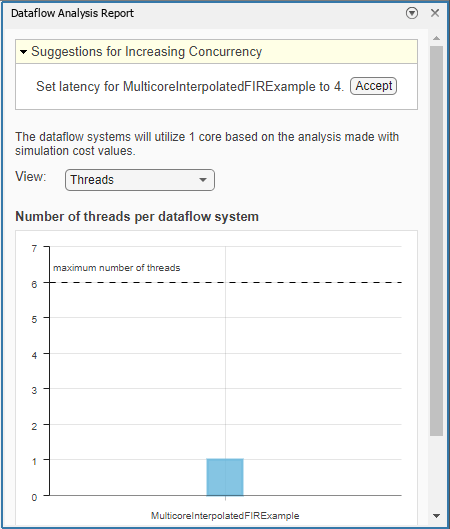
Click the Accept button to use the recommended latency for the dataflow system. You can also be enter a value manually in the Property Inspector by using the Latency parameter in the Execution tab. Simulink shows the Latency parameter value using tags at the output ports of the dataflow system.
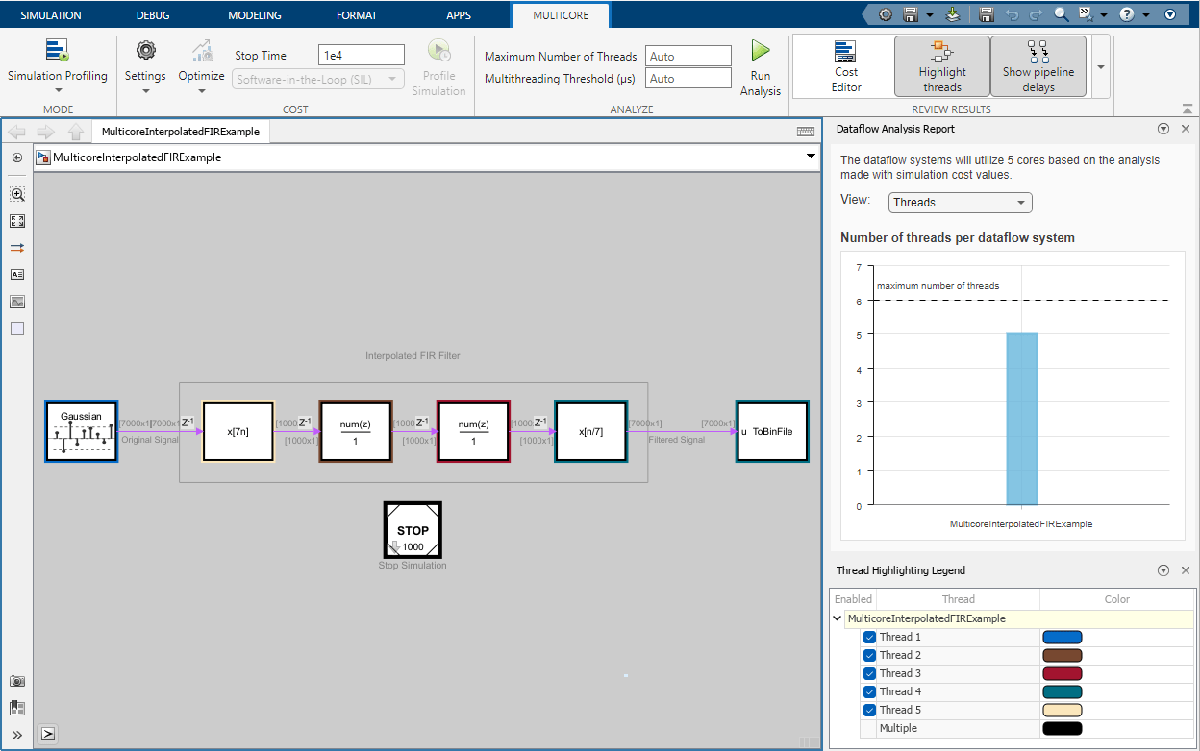
The Dataflow Analysis Report pane now shows the number of threads as 5, which means that the blocks inside the dataflow system simulate in parallel using five threads. When you click Highlight threads in the Simulink Toolstrip, the analysis highlights the blocks using the colors in the Thread Highlighting Legend pane. In the Review Results gallery, click Show pipeline delays to display tags that indicate where the pipelining delays were inserted in the dataflow system. The number of threads that can be used in the dataflow domain depends on the machine configuration and the filter specifications defined in ifir_init.m.
Calculate Simulation Performance
Simulate the model and measure the model execution time. To measure the execution time, use the sim command. To calculate the increase in performance, divide the execution time by the execution time of the original model.
The simulation time improvement may vary on different hardware. On a Windows desktop computer with Intel® Xeon® CPU W-2133 v3 @ 3.6 GHz 6 Cores 12 Threads processor, the version of the model that uses dataflow domain executes 3.3 times faster than the original model.
This example includes the function CalculateSpeedup. This function sets parameters and calculates the increase in performance of the model on your own hardware. Run the function by entering:
CalculateSpeedup;
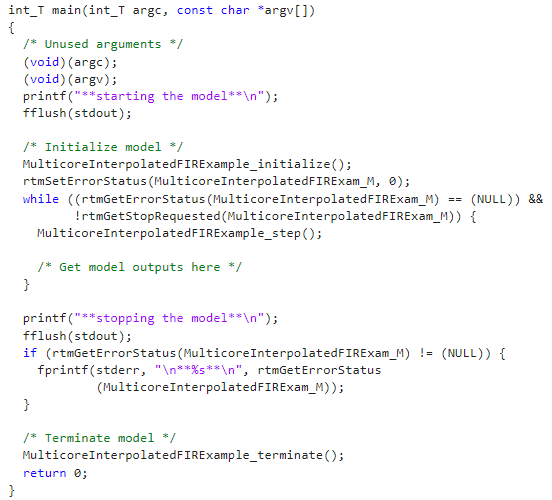
Generate Code
You must have a Simulink Coder™ or an Embedded Coder® license to generate code. To enable multicore code generation for the model, open the Configuration Parameters dialog. In the Solver pane, under Solver details, select Allow tasks to execute concurrently on target. Selecting this parameter allows:
Each rate in the model executes as an independent concurrent task on the target processor
The dataflow system generates additional concurrent tasks by automatically partitioning the blocks
In the Apps tab, click Embedded Coder. In the C Code tab, in the Generate Code section, set the Build drop-down to Generate Code. Click Generate Code.
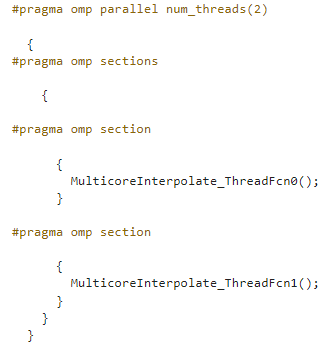
In the generated code, you can observe the generated functions for each concurrent task created by the dataflow domain as an OpenMP section. The model generates two thread functions, MulticoreInterpolate_ThreadFcn0 and MulticoreInterpolate_ThreadFcn1.
The code for the main program does not use timers or time steps, and instead uses a while loop for the step function. The code executes a finite number of steps based on the Number of steps parameter in the Stop Simulation block. To run the generated code indefinitely remove the Stop Simulation block from the model. MAT-File logging is not supported in code generation of a root model with dataflow domain. The MATLAB System block, which runs ToBinFile.m, is provided to verify the output data in code generation. To read the output data, run the following command in the MATLAB Command Window: fread(fid,'double');