Envelope Detection in Simulink
This example shows how to implement two common methods of envelope detection in Simulink®. One method uses squaring and lowpass filtering. The other uses the Hilbert transform. For a similar example in MATLAB®, see Envelope Detection in MATLAB.
Method 1: Squaring and Lowpass Filtering
Method 1 works by squaring the input signal and sending it through a lowpass filter. In this Simulink example, you use a simple minimum-phase lowpass filter to remove the high-frequency energy. In order to maintain the correct scaling, this method also includes two more operations. In the first operation, you place a gain of 2 on the signal. Since you are keeping only the lower half of the signal energy, this gain boosts the final energy to match its original energy. In the second operation, you take the square root of the signal to reverse the scaling distortion from the input signal squaring operation. This method is useful because it is very easy to implement and you can perform it with a low-order filter, minimizing the lag of the output.
Method 2: The Hilbert Transform
Method 2 works by creating the analytic signal of the input using a Hilbert transformer. In this Simulink example, you compute the Hilbert transform of the signal using a 32-point Parks-McClellan FIR filter. You then multiply the Hilbert transform of the signal by the imaginary unit i and add it to the original signal. You time-delay the original signal before adding it to the Hilbert transform to match the delay caused by the Hilbert transform, which is one-half the length of the Hilbert filter. You compute the envelope of the signal by taking the absolute value of the analytic signal. In order to eliminate ringing, and smooth the envelope, apply a lowpass filter to the result. You can also use the Analytic Signal block in the DSP System Toolbox™ library to implement this envelope detection design.
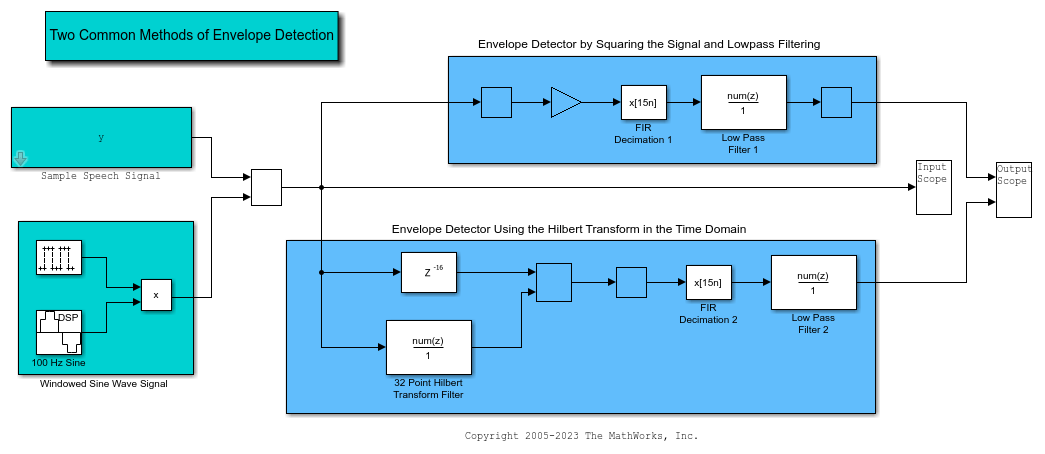
Envelope Detector Model
This example uses a preconfigured all-platform floating-point Simulink model named dspenvdt. Open the model.
Envelope Detector Results
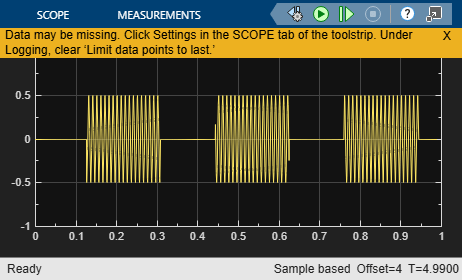
When you run the model, you can view the original signal as well as the results from the two envelope detectors. The input signal can be a sample speech signal or a 100 Hz sine wave signal. You can switch between the two input signals and view the input signal and the outputs from the two detectors in separate scopes. If a signal is not visible, double-click the Scope block to open it. The input scope plot shows the original signal. The signal lasts a total of 5 seconds, with the scope displaying 1 second of data at a time.
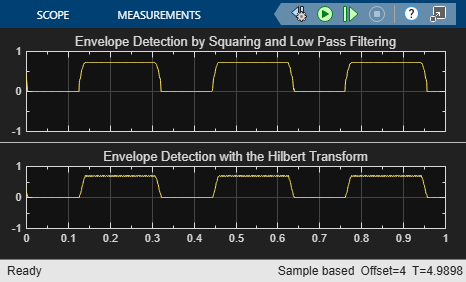
The first output scope plot shows the output of the first envelope detector. This is the result of squaring the original signal and sending it through a lowpass filter. You can clearly see that the envelope was successfully extracted from the speech signal.
The second output scope plot shows the output of the second envelope detector, which employs a Hilbert transform. Though the output of this envelope detector looks very similar to the first method, you can see differences between them.