Configure Logic Analyzer
Open the Logic Analyzer and select Settings from the toolstrip. A global settings dialog box opens. Any setting you change for an individual signal supersedes the global setting. The Logic Analyzer saves any setting changes with the model (Simulink®) or System object™ (MATLAB®).
Set the display Radix of your signals as one of the following:
Hexadecimal— Displays values as symbols from zero to nine and A to FOctal— Displays values as numbers from zero to sevenBinary— Displays values as zeros and onesSigned decimal— Displays the signed, stored integer valueUnsigned decimal— Displays the stored integer value
Set the display Format as one of the following:
Automatic— Displays floating point signals inAnalogformat and integer and fixed-point signals inDigitalformat. Boolean signals are displayed as zero or one.Analog— Displays values as an analog plotDigital— Displays values as digital transitions
Set the display Time Units to one of the following:
Automatic— Uses a time scale appropriate to the time range shown in the current plotsecondsmillisecondsmicrosecondsnanosecondspicosecondsfemtoseconds
Set the Boolean Highlighting to one of the following:
NoneRows— Adds a highlighted background for the entire Boolean signal row.
Select Highlight boolean values to add highlighting to Boolean signals.
Gradient— Adds color highlighting to Boolean signals based on value. If the signal value istrue, the highlight fades out below. If the signal value isfalse, the signal fades out above. With this option, you can visually deduce the value of the signal.
Set the Axes Theme to one of the following:
Black(default) — Set the background color of the Logic Analyzer display to black (dark).White— Set the background color of the Logic Analyzer display to white (light).Auto— Match the background color of the Logic Analyzer display with the MATLAB theme.
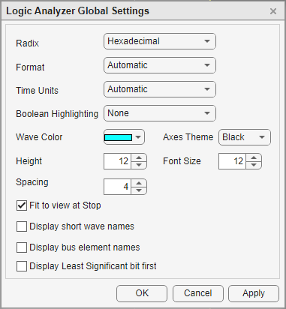
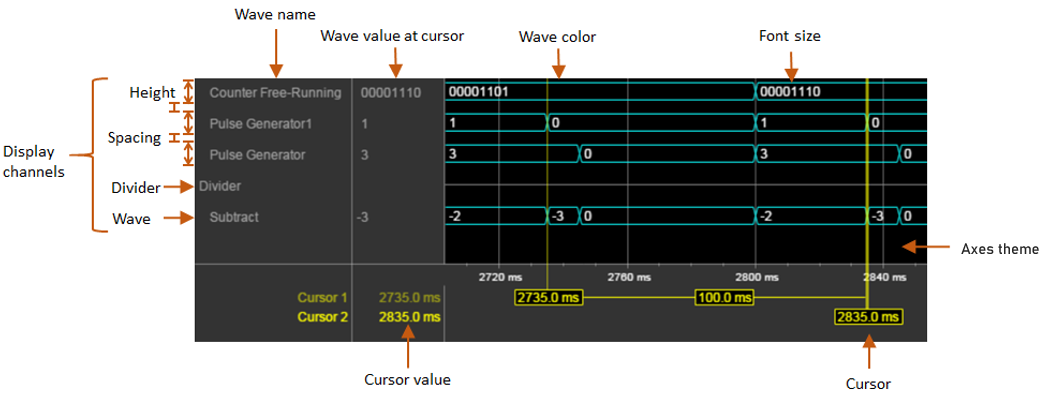
Inspect the graphic for an explanation of the global settings: Wave
Color, Axes Theme,
Height, Font Size, and
Spacing. Font Size applies only to
the text within the axes.
By default, when your simulation stops, the Logic Analyzer shows all the data for the simulation time on one screen. If you do not want this behavior, clear Fit to view at Stop. This option is disabled for long simulation times.
To display the short names of waves without path information, select Display short wave names.
You can expand fixed-point and integer signals and view individual bits. The Display Least Significant bit first option enables you to reverse the order of the displayed bits.
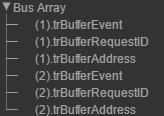
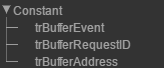
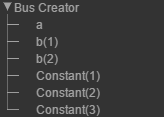
If you stream logged bus signals to the Logic Analyzer, you can display the names of the signals inside the bus using the Display bus element names option. To show bus element names:
Add the bus signal for logging.
In the Logic Analyzer settings, select the Display bus element names check box.
Run the simulation.
When you expand the bus signals, you will see the bus signal names.
Some special situations:
If the signal has no name, the Logic Analyzer shows the block name instead.
If the bus is a bus object, the Logic Analyzer shows the bus element names specified in the Bus Object Editor.
If one of the bus elements contains an array, each element of the array is appended with the element index.
If a bus element contains an array with complex elements, the real and complex values (
i) are split.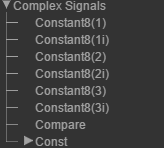
Bus signals passed through a Gain block are labeled
Gain(1),Gain(2),...Gain(n).If the bus contains an array of buses, the Logic Analyzer prepends the element name with the bus array index.