Model Array with Variations in Two Parameters
This example shows how to create a two-dimensional (2-D) array of transfer functions using for loops. One parameter of the transfer function varies in each dimension of the array.
You can use the technique of this example to create higher-dimensional arrays with variations of more parameters. Such arrays are useful for studying the effects of multiple-parameter variations on system response.
The second-order single-input, single-output (SISO) transfer function
depends on two parameters: the damping ratio, , and the natural frequency, . If both and vary, you obtain multiple transfer functions of the form:
where and represent different measurements or sampled values of the variable parameters. You can collect all of these transfer functions in a single variable to create a two-dimensional model array.
Preallocate memory for the model array. Preallocating memory is an optional step that can enhance computation efficiency. To preallocate, create a model array of the required size and initialize its entries to zero.
H = tf(zeros(1,1,3,3));
In this example, there are three values for each parameter in the transfer function H. Therefore, this command creates a 3-by-3 array of single-input, single-output (SISO) zero transfer functions.
Create arrays containing the parameter values.
zeta = [0.66,0.71,0.75];
w = [1.0,1.2,1.5];
Build the array by looping through all combinations of parameter values.
for i = 1:length(zeta)
  for j = 1:length(w)
    H(:,:,i,j) = tf(w(j)^2,[1 2*zeta(i)*w(j) w(j)^2]);
  end
end
H is a 3-by-3 array of transfer functions. varies as you move from model to model along a single column of H. The parameter varies as you move along a single row.
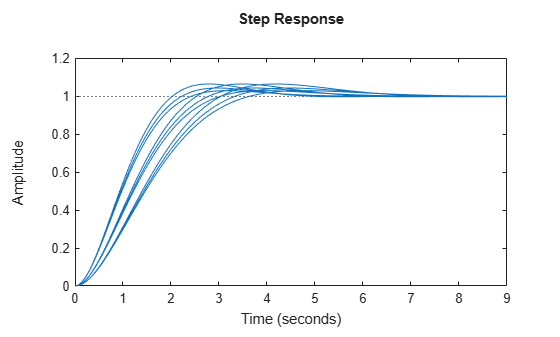
Plot the step response of H to see how the parameter variation affects the step response.
stepplot(H)
You can set the SamplingGrid property of the model array to help keep track of which set of parameter values corresponds to which entry in the array. To do so, create a grid of parameter values that matches the dimensions of the array. Then, assign these values to H.SamplingGrid with the parameter names.
[zetagrid,wgrid] = ndgrid(zeta,w);
H.SamplingGrid = struct('zeta',zetagrid,'w',wgrid);
When you display H, the parameter values in H.SamplingGrid are displayed along with the each transfer function in the array.