Interpret Polyspace Code Prover Results in Polyspace Platform User Interface
This topic describes how to review and interpret a result of a Polyspace® Code Prover™ analysis in the Polyspace Platform user interface.
When you open the results of a Polyspace Code Prover analysis, you see a list on the Results List pane. The list consists of run-time checks, coding rule violations, code metrics, and global variable usage.
You can first narrow down the focus of your review:
Use filters in the Filters section of the toolstrip to narrow down the list. For example, use the High Severity filter to focus on high severity defects.
Organize results by result family. Click a column title to sort the column. Use the Show only and Filter out options to include or exclude entire result families.
Because the results of a Code Prover run-time check are dependent on the results of checks from earlier in your source code, you should review run-time checks from the beginning to the end of a function.
For more information on filtering and sorting the results list, see Filter and Sort Results in Polyspace Platform User Interface. Once you narrow down the list of results, you can begin reviewing individual results.
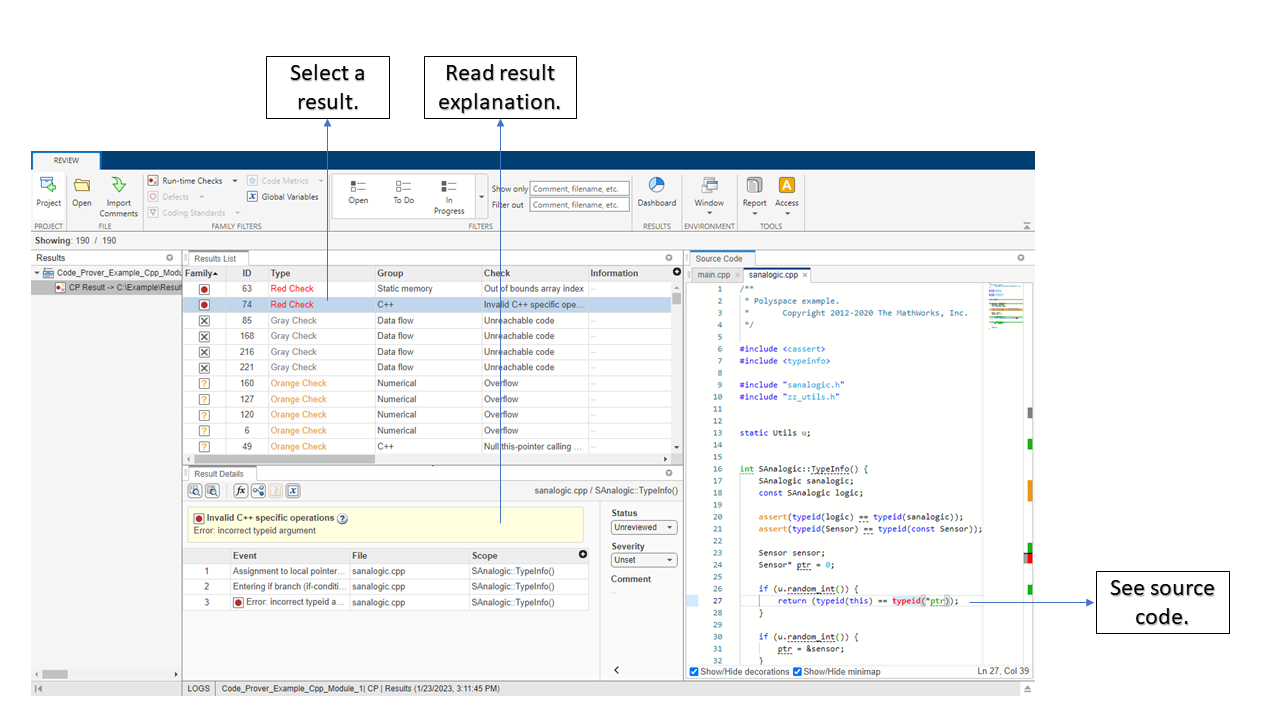
To begin your review, select a result in the Results List pane. An explanation of the result appears in the Result Details pane. In the Source Code pane, lines of code that are relevant to the results are highlighted.
Interpret Result
The first step is to understand the nature of the issue. Read the message on the Result Details pane and the related line of code on the Source Code pane. You can use the message to decide whether to fix the issue.
Here is an example of a message that appears in the Result Details pane.
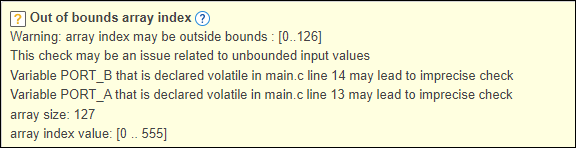
The message consists of several parts:
The color and icon of the check. Code Prover uses these icons in checks for run-time errors:
 — Red circle indicates a definite error.
 — Orange question mark indicates a possible error.
 — Gray X indicates unreachable code.
 — Green check mark indicates that a specific error cannot happen.
The description of the run-time check.
In the example, the check determines if an array index goes outside the range of valid array indexes.
Values relevant to the run-time check.
In the example, the message states the array bounds (
[0..126]), the array size (127), and the range of values that the array index variable can take at that point in the code ([0..555]).Relevant sources of imprecision (for orange checks).
In the example, the message states that two volatile variables might be responsible for the check.
For more information on results and source code colors, see Code Prover Result and Source Code Colors.
See Variable Ranges in Source Code Tooltips
On the Source Code pane, tooltips appear when you point to some variables and operations. Variables and operations with tooltips appear with an underline.
![]()
In this example, tooltips appear on:
The variable
s8_ret— The tooltip shows its data type and range of values before the+operation.If a data type conversion occurs during the + operation, you also see this conversion in the tooltip.
The + operation — The tooltip shows the values of the left and right operands, and the value of the result.
The = assignment operator — The tooltip shows any data type conversion that occurs during the assignment and the result.
Get Additional Help
To open a help page for the selected result, click the More Help icon ![]() in the Result Details pane. The code examples in the help page illustrate the result.
in the Result Details pane. The code examples in the help page illustrate the result.
Find Root Cause of Result
The root cause of a result can be located far from the location in the code where you see the result. For example, a variable that you read might not be initialized because the initialization is not reachable. Polyspace reports this defect when you read the variable, but the root cause is the unreachable code where the initialization occurs.
Navigate in Source Code
Sometimes, the Result Details pane shows one sequence of events that leads to the result. However, in most situations, you have to find your own pathways through the code as you trace the source of a result. Use tooltips on variables to follow the propagation of variable ranges as you navigate through the code.
int func (int var) { /* Initial range of var */
     …
     var -= get ();  /* New range of var */
     …
     set(&var);     /* New range of var */
}
Use these methods to quickly navigate through the code:
Search for all references to a variable and browse through them.
Highlight and right-click the variable name on the Source Code pane and select Search For All References. These options perform more than a string match. The options show only instances of a specific variable and not other variables with the same name in other scopes.
Navigate from a function call to its definition.
Right-click the function name on the Source Code pane. Select Go To Definition.
Navigate from a function to its callers and callees.
Click the Show Call Hierarchy icon
 on the Result Details pane to
open the Call Hierarchy pane. You see the function containing
the result with its callers and callees. Click a caller or callee name to navigate
to the call site in the Source Code pane. Double-click a name
to navigate to the definition.
on the Result Details pane to
open the Call Hierarchy pane. You see the function containing
the result with its callers and callees. Click a caller or callee name to navigate
to the call site in the Source Code pane. Double-click a name
to navigate to the definition.Alternatively, click the Show Error Call Graph icon
 to open the Error Call Graph pane, which shows a graphical representation of the call sequence leading to the result. To navigate to functions in this sequence, click through nodes in the graph.
Navigate from a function call or loop keyword to an error in the function or loop body.
If the error occurs only in a specific function call or specific loop iteration, the function call or loop iteration is highlighted in red. Right-click function call or loop keyword highlighted in red. Select Go To Cause if the option is available.
Navigate across all instances of a global variable.
Click View > Global Variable Usage to open the Global Variables Usage pane. See all global variables in the result and the read and write operations on them.
Before you begin navigating through pathways in your code, determine what you are looking for and choose the appropriate navigation tool. For instance:
To investigate a Non-initialized variable defect, check whether the variable is initialized at all in the code. To look for other instances of the variable, on the Source Code pane, right-click the variable and select Search For All References.
For other examples of what to look for, see Reviewing Code Prover Run-Time Checks.