Run Polyspace Analysis on Custom Code in C Caller Blocks and Stateflow Charts
You can check for bugs and run-time errors in the custom C/C++ code used in your Simulink® model. The Polyspace® analysis checks functions called from C Caller blocks and Stateflow® charts with inputs from the model.
Prerequisites
Before you run Polyspace from Simulink, you must link your Polyspace and MATLAB® installations. See Integrate Polyspace with MATLAB and Simulink.
To open the models used in this example, look for this example in the Polyspace Code Prover™ documentation, click the Copy Command button, and then paste the command in the MATLAB Command Window.
C/C++ Function Called Once in Model
This example uses a function called only once in the model from a C Caller (Simulink) block. The analysis checks the function using inputs to the C Caller block.
Open Model for Running Analysis on Custom Code
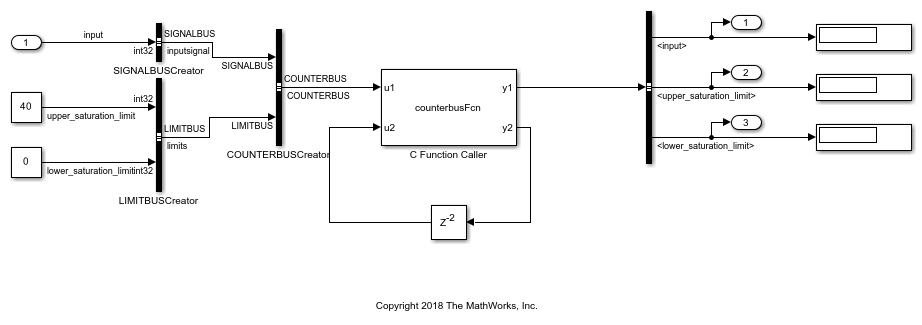
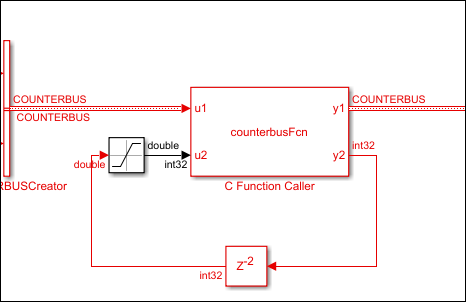
Open the model mSlccBusDemo for analyzing custom code with Polyspace. The model contains a C Caller block that calls a function counterbusFcn defined in a file hCounterBus.c (declared in file hCounterBus.h). The model uses variables saved in a MAT file dLctData.mat, which is loaded in the model using a callback.
Run Analysis
Configure analysis options and run Polyspace.
On the Apps tab, select Polyspace Code Verifier to open the Polyspace tab.
Specify the type of analysis:
Select the product to run, Bug Finder or Code Prover. A Code Prover analysis detects run-time errors while a Bug Finder analysis detects coding defects and coding rule violations.
Specify that the analysis must run on custom code in the model instead of generated code.
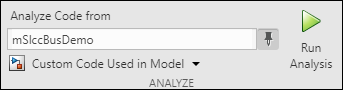
The Analyze Code from field shows the model name. Below the field, instead of Code Generated as Top Model, select Custom Code Used in Model.
Select Run Analysis.
Follow the progress of analysis in the MATLAB Command Window. After the analysis, on the Polyspace tab, select Analysis Results. The results open in the Polyspace user interface.
You can also run the same analysis from MATLAB as follows. The script includes commands to load the model and the .mat file containing variables used in the model.
openExample('polyspace_code_prover/OpenModelForRunningAnalysisOnCustomCodeExample');
load_system('mSlccBusDemo');
load('dLctData.mat');

mlopts = pslinkoptions('mSlccBusDemo');
mlopts.VerificationMode = 'CodeProver';
pslinkrun('-slcc','mSlccBusDemo',mlopts);
Fix Issues
The rest of this tutorial shows how to investigate and fix issues found in a Code Prover analysis. Similar steps can be followed for issues found with Bug Finder.
If you run a Code Prover analysis, the results contain an orange Overflow check.
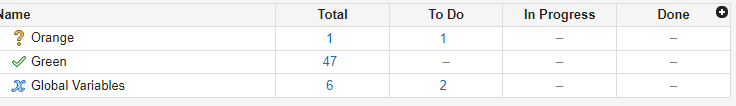
Click the Review button to open the results list. The orange check appears on the Results List pane in the Polyspace Platform user interface. Click the orange check to see further details on the Result Details pane and the corresponding source code on the Source pane.
The check highlights an addition operation in the counterbusFcn function that can overflow:
limit = u1->inputsignal.input + u2;counterbusFcn, which in turn come from these inputs to the C Caller block:
The bus
COUNTERBUS, which combines the signalsinput,upper_saturation_limit, andlower_saturation_limit. The signalinputis unbounded.The feedback from the C Caller block itself through a Delay block.
You can constrain the signal named input in several ways. For instance, you can constrain the Simulink.Bus object named SIGNALBUS that contains input:
In the Simulink Toolstrip, on the Modeling tab, in the Design gallery, click Type Editor. To expand an external data source or bus, click the arrow next to its name.
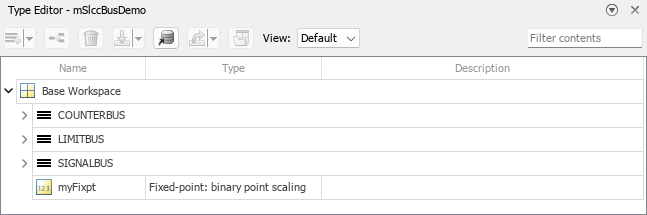
The base workspace contains a
Simulink.Busobject namedSIGNALBUS.In the Type Editor, set View to
Valueand expandSIGNALBUS.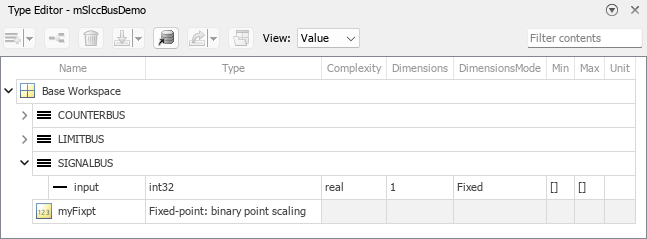
Specify a minimum and maximum value for the
inputelement ofSIGNALBUS.Save the bus object in a MAT file. You can overwrite the file
dLctData.mator create a file.
You can also constrain the feedback from the C Caller block in several ways. For instance, you can saturate the feedback signal:
Add a Saturation block immediately before the feedback signal is input to the C Caller block.
On the Signal Attributes tab, specify a minimum and maximum value for the Saturation block output.
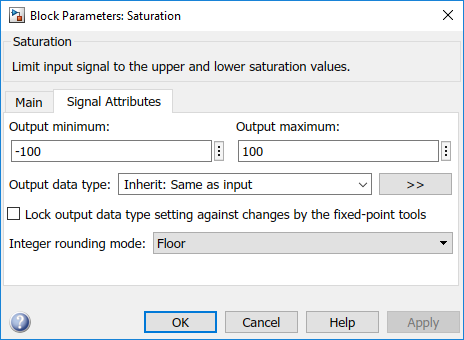
Note that specifying a lower and upper limit on the Main tab of the Saturation block is not sufficient to constrain the signal for the Polyspace analysis. The analysis uses the design ranges specified on the Signal Attributes tab.
Rerun the analysis. The Overflow check in the new set of results is green.
C/C++ Function Called Multiple Times in Model
This example uses a function called from multiple C Caller blocks in the model. The function simply returns the product of its two arguments.
The example runs a Code Prover analysis and shows how to determine the function call context starting from Code Prover results. Typically, in a Bug Finder analysis, you do not need to distinguish between different call contexts.
Open Model for Analyzing All Custom Code
Open the model multiCCallerBlocks for running Polyspace analysis.
openExample('polyspace_bf/OpenModelForAnalyzingAllCustomCodeExample');
open_system('multiCCallerBlocks');
ans =

  logical

   1

Inspect Model
The model contains two C Caller blocks calling the same function times_n. The inputs to one C Caller block come from two Inport blocks that have unbounded input. The inputs to the other C Caller block come from a Constant block and an Inport block that has the input bounded by a Saturation block.
To see the design ranges for the C Caller block that has bounded inputs:
Double-click the Constant block or the Saturation block.
On the Signal Attributes tab, note the design range.
For instance, although the Constant block has the constant value set to 3, the design range for verification is 2.5 to 3.5.
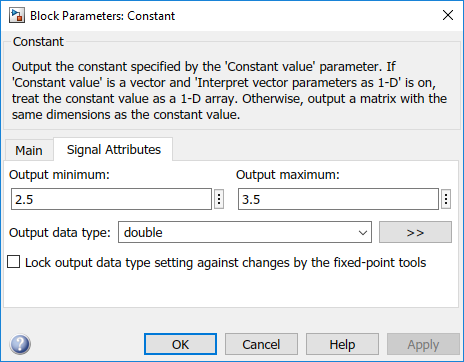
The design range for the Saturation block is [-1,1].
Run Analysis and Review Results
Run analysis as in the previous example and open the results.
The Results List pane shows an orange Overflow check. The product in the times_n function overflows.
#include "file.h"

double times_n(double x, double n) {
  return x * n;
}times_n function is called from two contexts, the orange color combines both contexts and might indicate two possible situations:
The overflow occurs in both call contexts.
The overflow is proven to not occur in one context (green check) and might occur in the other context (orange check).
To determine which call context leads to the overflow:
See the callers of
times_n.Select the orange Overflow check. On the Result Details pane, click
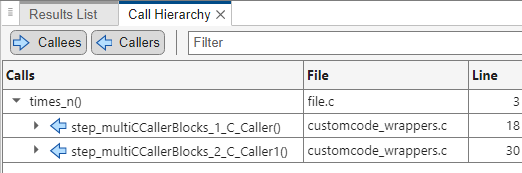
 . The Call Hierarchy pane shows
the callers of
. The Call Hierarchy pane shows
the callers of times_n.On the Call Hierarchy pane, you see two wrapper functions as callers. Each wrapper function represents a C Caller block in the model.
Select one of the wrapper functions to open the source code for
customcode_wrappers.c.On the Source pane, inspect the code for the wrapper functions. To determine which inputs lead to the overflow, use tooltips on underlined inputs.
For instance, the wrapper function for the C Caller block that has bounded inputs looks similar to this code:
Use tooltips on the variables to determine their ranges. For instance, the tooltip on the variable/* Go to model '<Root>/C Caller1' */ /* Variables corresponding to inputs for block C Caller1 */ real64_T In1_multiCCallerBlocks_2_C_Caller1; real64_T In2_multiCCallerBlocks_2_C_Caller1; /* Variables corresponding to outputs for block C Caller1 */ real64_T Out1_multiCCallerBlocks_2_C_Caller1; /* Wrapper functions for code in block C Caller1 */ void step_multiCCallerBlocks_2_C_Caller1(void) { /* See tooltips on function inputs for input ranges */ Out1_multiCCallerBlocks_2_C_Caller1 = times_n(In1_multiCCallerBlocks_2_C_Caller1, In2_multiCCallerBlocks_2_C_Caller1); }
In1_multiCCallerBlocks_2_C_Caller1shows that it is in the range [2.5, 3.5] and the tooltip on_pslink_C_Caller1_In2shows that it is in the range [-1,1]. Therefore, the product of the two inputs cannot overflow. The overflow must come from the other call context. You can see the tooltips on the inputs to the other call and confirm that the variables are unbounded.To locate the C Caller block corresponding to a wrapper function, on the Source pane, click the blue block name link above the wrapper function (on the line starting with
Go to model). In the Simulink editor, the corresponding C Caller block is highlighted.
Enable Context Sensitivity and Rerun Analysis
In this example, the function is simple enough that you can determine which call context leads to the overflow from the function inputs themselves. For more complex functions, you can configure the analysis to show results from the two contexts separately.
Because distinguishing call contexts involves a deeper analysis, the analysis might take longer. Therefore, enable context sensitivity only for specific functions and only if you are not able to distinguish the call contexts by inspection.
In this example, to enable context sensitivity for the times_n function:
In your model, on the Polyspace tab, select Settings > Project Settings.
On the Static Analysis tab, locate Run Time Errors > Precision and select
customfor the option Sensitivity context. Click to add an empty row and enter
times_n.See also
Sensitivity context
                  (-context-sensitivity)
(Polyspace Code Prover).
Rerun the analysis from the model and reopen the results. Select the orange Overflow check.
The Result Details pane shows the call contexts separately. You can see that the overflow occurs only for the call with unbounded inputs (row with orange text) and does not occur for the other call (row with green text).
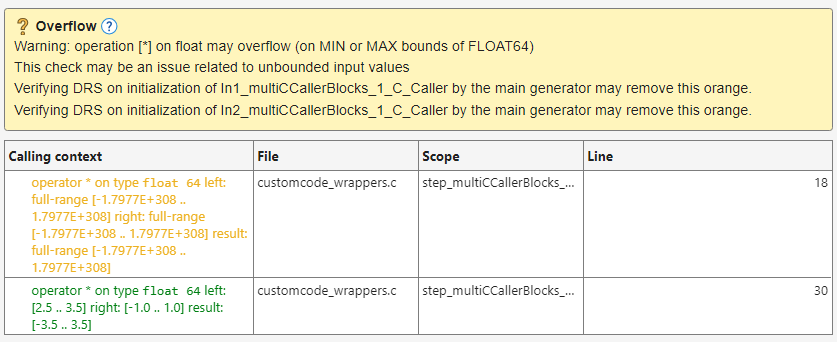
Click the row with orange text to directly navigate to the wrapper function leading to the orange check. From the wrapper function, you can navigate to the C Caller block with unbounded inputs.