probesetplot
Plot Affymetrix probe set intensity values
Syntax
probesetplot(CELStruct, CDFStruct, PS)


probesetplot(CELStruct, CDFStruct, PS,
...'GeneName', GeneNameValue, ...)

probesetplot(CELStruct, CDFStruct, PS,
...'Field', FieldValue, ...)

probesetplot(CELStruct, CDFStruct, PS,
...'ShowStats', ShowStatsValue, ...)
Arguments
CELStruct | Structure created by the affyread function
from an Affymetrix® CEL file. |
CDFStruct | Structure created by the affyread function
from an Affymetrix CDF library file associated with the CEL file. |
PS | Probe set index or the probe set ID/name. |
GeneNameValue | Controls whether the probe set name or the gene name is used
for the title of the plot. Choices are true or false (default).Note The |
FieldValue | Character vector or string specifying the type of data to plot. Choices are:
|
ShowStatsValue | Controls whether the mean and standard deviation lines are
included in the plot. Choices are true or false (default). |
Description
probesetplot( plots
the PM (perfect match) and MM (mismatch) intensity values for a specified
probe set. CELStruct, CDFStruct, PS)CELStruct is a structure created
by the affyread function from
an Affymetrix CEL file. CDFStruct is
a structure created by the affyread function
from an Affymetrix CDF library file associated with the CEL file. PS is
the probe set index or the probe set ID/name.
Note
MATLAB® software uses 1-based indexing
for probe set numbers, while the Affymetrix CDF file uses 0-based
indexing for probe set numbers. For example, CDFStruct.ProbeSets(1) has
a ProbeSetNumber of 0 in the ProbePairs field.
probesetplot( calls CELStruct, CDFStruct, PS,
...'PropertyName', PropertyValue,
...)probesetplot with optional
properties that use property name/property value pairs. You can specify
one or more properties in any order. Each PropertyName must
be enclosed in single quotation marks and is case insensitive. These
property name/property value pairs are as follows:
probesetplot( controls
whether the probe set name or the gene name is used for the title
of the plot. Choices are CELStruct, CDFStruct, PS,
...'GeneName', GeneNameValue, ...)true or false (default).
Note
The 'GeneName' property requires the GIN
library file associated with the CEL and CDF files to be located in
the same folder as the CDF library file from which CDFStruct was
created.
probesetplot( specifies
the type of data to plot. Choices are: CELStruct, CDFStruct, PS,
...'Field', FieldValue, ...)
'Intensity'(default)'StdDev''Background''Pixels''Outlier'
probesetplot( controls
whether the mean and standard deviation lines are included in the
plot. Choices are CELStruct, CDFStruct, PS,
...'ShowStats', ShowStatsValue, ...)true or false (default).
Examples
Plot Affymetrix™ Probe Set Intensity Values
You need some sample data files from here. This example uses the sample data from the E. coli Antisense Genome Array. Extract the data files from the DTT archive using the Data Transfer Tool.
You also need to download the corresponding library files for the sample. For this example, Ecoli_ASv2.CDF and Ecoli_ASv2.GIN are used as for the E. coli Antisense Genome Array. You may already have these files if you have any Affymetrix GeneChip software installed on your machine. If not, get the library files by downloading the E. coli Antisense Genome Array zip file from here.
Read the contents of a CEL file into a MATLAB structure.
celStruct = affyread('Ecoli-antisense-121502.CEL');
Read the contents of a CDF file into a MATLAB structure.
cdfStruct = affyread('C:\LibFiles\Ecoli_ASv2.CDF');
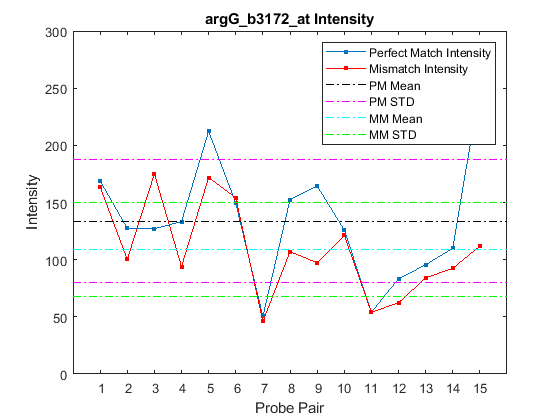
Plot the PM and MM intensity values of the argG_b3172_at probe set, including the mean and standard deviation.
probesetplot(celStruct, cdfStruct, 'argG_b3172_at','showstats', true)
Version History
Introduced before R2006a
See Also
affyread | celintensityread | probesetlookup | probesetvalues
You can also select a web site from the following list:
Americas
- América Latina (Español)
- Canada (English)
- United States (English)
Europe
- Belgium (English)
- Denmark (English)
- Deutschland (Deutsch)
- España (Español)
- Finland (English)
- France (Français)
- Ireland (English)
- Italia (Italiano)
- Luxembourg (English)
- Netherlands (English)
- Norway (English)
- Österreich (Deutsch)
- Portugal (English)
- Sweden (English)
- Switzerland
- United Kingdom (English)