correlation
Correlation coefficient between two antennas in array
Description
correlation(
calculates and plots the correlation coefficient between two antenna elements,
array,frequency,elem1,elem2,z0)elem1 and elem2 of an array. The
correlation values are calculated for a specified frequency and impedance and
for a specified impedance z0.
Examples
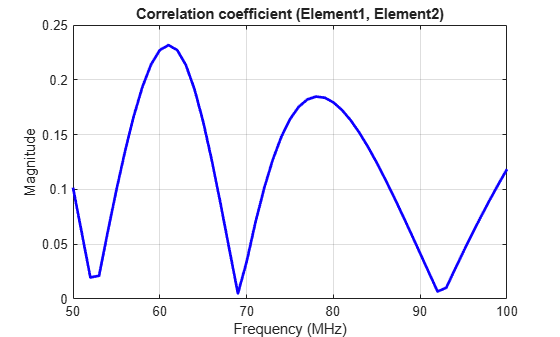
Plot Correlation of Array
Plot the correlation between 1 and 2 antenna elements in a default linear array over a frequency range of 50MHz to 100MHz.
h = linearArray;
correlation (h,50e6:1e6:100e6,1,2);
Calculate Correlation Coefficient of Array
Calculate correlation coefficient of default rectangular array at a frequency range of 50MHz to 100MHz.
h = rectangularArray;
rho = correlation (h, 50e6:1e6:100e6, 1, 2)
rho = 51×1

    0.1417
    0.1123
    0.0826
    0.0524
    0.0215
    0.0102
    0.0429
    0.0763
    0.1094
    0.1409
      ⋮
Input Arguments
Output Arguments
References
[1] S. Blanch, J. Romeu, and I. Corbella. Exact representation of antenna system diversity performance from input parameter description. Electron. Lett., vol. 39, pp. 705-707, May 2003.
Version History
Introduced in R2015a
See Also
You can also select a web site from the following list:
Americas
- América Latina (Español)
- Canada (English)
- United States (English)
Europe
- Belgium (English)
- Denmark (English)
- Deutschland (Deutsch)
- España (Español)
- Finland (English)
- France (Français)
- Ireland (English)
- Italia (Italiano)
- Luxembourg (English)
- Netherlands (English)
- Norway (English)
- Österreich (Deutsch)
- Portugal (English)
- Sweden (English)
- Switzerland
- United Kingdom (English)