mvtcdf
Multivariate t cumulative distribution function
Syntax
y = mvtcdf(X,C,DF)

y = mvtcdf(xl,xu,C,DF)

[y,err] = mvtcdf(...)

[...] = mvntdf(...,options)
Description
y = mvtcdf(X,C,DF) returns
the cumulative probability of the multivariate t distribution
with correlation parameters C and degrees of freedom DF,
evaluated at each row of X. Rows of the n-by-d matrix X correspond
to observations or points, and columns correspond to variables or
coordinates. y is an n-by-1 vector.
C is a symmetric, positive definite, d-by-d matrix,
typically a correlation matrix. If its diagonal elements are not 1, mvtcdf scales C to
correlation form. mvtcdf does not rescale X. DF is
a scalar, or a vector with n elements.
The multivariate t cumulative probability
at X is defined as the probability that a random
vector T, distributed as multivariate t,
will fall within the semi-infinite rectangle with upper limits defined
by X, i.e., Pr{T(1)≤X(1),T(2)≤X(2),...T(d)≤X(d)}.
y = mvtcdf(xl,xu,C,DF) returns
the multivariate t cumulative probability evaluated
over the rectangle with lower and upper limits defined by xl and xu,
respectively.
[y,err] = mvtcdf(...) returns
an estimate of the error in y. For bivariate and
trivariate distributions, mvtcdf uses adaptive
quadrature on a transformation of the t density,
based on methods developed by Genz, as described in the references.
The default absolute error tolerance for these cases is 1e-8.
For four or more dimensions, mvtcdf uses a quasi-Monte
Carlo integration algorithm based on methods developed by Genz and
Bretz, as described in the references. The default absolute error
tolerance for these cases is 1e-4.
[...] = mvntdf(...,options) specifies
control parameters for the numerical integration used to compute y.
This argument can be created by a call to statset.
Choices of statset parameters are:
'TolFun'— Maximum absolute error tolerance. Default is1e-8when d < 4, or1e-4when d ≥ 4.'MaxFunEvals'— Maximum number of integrand evaluations allowed when d ≥ 4. Default is1e7.'MaxFunEvals'is ignored when d < 4.'Display'— Level of display output. Choices are'off'(the default),'iter', and'final'.'Display'is ignored when d < 4.
Examples
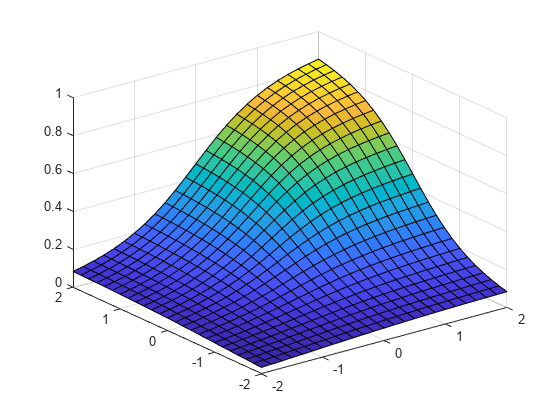
Compute the Multivariate t Distribution cdf
Compute the cdf of a multivariate t distribution with correlation parameters C = [1 .4; .4 1] and 2 degrees of freedom.
C = [1 .4; .4 1];
df = 2;
[X1,X2] = meshgrid(linspace(-2,2,25)',linspace(-2,2,25)');
X = [X1(:) X2(:)];
p = mvtcdf(X,C,df);
Plot the cdf.
figure;
surf(X1,X2,reshape(p,25,25));
References
[1] Genz, A. “Numerical Computation of Rectangular Bivariate and Trivariate Normal and t Probabilities.” Statistics and Computing. Vol. 14, No. 3, 2004, pp. 251–260.
[2] Genz, A., and F. Bretz. “Numerical Computation of Multivariate t Probabilities with Application to Power Calculation of Multiple Contrasts.” Journal of Statistical Computation and Simulation. Vol. 63, 1999, pp. 361–378.
[3] Genz, A., and F. Bretz. “Comparison of Methods for the Computation of Multivariate t Probabilities.” Journal of Computational and Graphical Statistics. Vol. 11, No. 4, 2002, pp. 950–971.
Version History
Introduced in R2006a
You can also select a web site from the following list:
Americas
- América Latina (Español)
- Canada (English)
- United States (English)
Europe
- Belgium (English)
- Denmark (English)
- Deutschland (Deutsch)
- España (Español)
- Finland (English)
- France (Français)
- Ireland (English)
- Italia (Italiano)
- Luxembourg (English)
- Netherlands (English)
- Norway (English)
- Österreich (Deutsch)
- Portugal (English)
- Sweden (English)
- Switzerland
- United Kingdom (English)