Main Content

gmdistribution

Create Gaussian mixture model

Description

A gmdistribution object stores a Gaussian mixture distribution, also called a Gaussian mixture model (GMM), which is a multivariate distribution that consists of multivariate Gaussian distribution components. Each component is defined by its mean and covariance. The mixture is defined by a vector of mixing proportions, where each mixing proportion represents the fraction of the population described by a corresponding component.

Creation

You can create a gmdistribution model object in two ways.

  • Use the gmdistribution function (described here) to create a gmdistribution model object by specifying the distribution parameters.

  • Use the fitgmdist function to fit a gmdistribution model object to data given a fixed number of components.

Description

example

gm = gmdistribution(mu,sigma) creates a gmdistribution model object using the specified means mu and covariances sigma with equal mixing proportions.

gm = gmdistribution(mu,sigma,p) specifies the mixing proportions of multivariate Gaussian distribution components.

Input Arguments

expand all

Means of multivariate Gaussian distribution components, specified as a k-by-m numeric matrix, where k is the number of components and m is the number of variables in each component. mu(i,:) is the mean of component i.

Data Types: single | double

Covariances of multivariate Gaussian distribution components, specified as a numeric vector, matrix, or array.

Given that k is the number of components and m is the number of variables in each component, sigma is one of the values in this table.

ValueDescription
m-by-m-by-k arraysigma(:,:,i) is the covariance matrix of component i.
1-by-m-by-k arrayCovariance matrices are diagonal. sigma(1,:,i) contains the diagonal elements of the covariance matrix of component i.
m-by-m matrixCovariance matrices are the same across components.
1-by-m vectorCovariance matrices are diagonal and the same across components.

Data Types: single | double

Mixing proportions of mixture components, specified as a numeric vector of length k, where k is the number of components. The default is a row vector of (1/k)s, which sets equal proportions. If p does not sum to 1, gmdistribution normalizes it.

Data Types: single | double

Properties

expand all

Distribution Parameters

This property is read-only.

Means of multivariate Gaussian distribution components, specified as a k-by-m numeric matrix, where k is the number of components and m is the number of variables in each component. mu(i,:) is the mean of component i.

  • If you create a gmdistribution object by using the gmdistribution function, then the mu input argument of gmdistribution sets this property.

  • If you fit a gmdistribution object to data by using the fitgmdist function, then fitgmdist estimates this property.

Data Types: single | double

This property is read-only.

Covariances of multivariate Gaussian distribution components, specified as a numeric vector, matrix, or array.

Given that k is the number of components and m is the number of variables in each component, Sigma is one of the values in this table.

ValueDescription
m-by-m-by-k arraySigma(:,:,i) is the covariance matrix of component i.
1-by-m-by-k arrayCovariance matrices are diagonal. Sigma(1,:,i) contains the diagonal elements of the covariance matrix of component i.
m-by-m matrixCovariance matrices are the same across components.
1-by-m vectorCovariance matrices are diagonal and the same across components.

  • If you create a gmdistribution object by using the gmdistribution function, then the sigma input argument of gmdistribution sets this property.

  • If you fit a gmdistribution object to data by using the fitgmdist function, then fitgmdist estimates this property.

Data Types: single | double

This property is read-only.

Mixing proportions of mixture components, specified as a 1-by-k numeric vector.

  • If you create a gmdistribution object by using the gmdistribution function, then the p input argument of gmdistribution sets this property.

  • If you fit a gmdistribution object to data by using the fitgmdist function, then fitgmdist estimates this property.

Data Types: single | double

Distribution Characteristics

This property is read-only.

Type of covariance matrices, specified as either 'diagonal' or 'full'.

  • If you create a gmdistribution object by using the gmdistribution function, then the type of covariance matrices in the sigma input argument of gmdistribution sets this property.

  • If you fit a gmdistribution object to data by using the fitgmdist function, then the 'CovarianceType' name-value pair argument of fitgmdist sets this property.

This property is read-only.

Distribution name, specified as 'gaussian mixture distribution'.

This property is read-only.

Number of mixture components, k, specified as a positive integer.

  • If you create a gmdistribution object by using the gmdistribution function, then the input arguments mu, sigma, and p of gmdistribution set this property.

  • If you fit a gmdistribution object to data by using the fitgmdist function, then the k input argument of fitgmdist sets this property.

Data Types: single | double

This property is read-only.

Number of variables in the multivariate Gaussian distribution components, m, specified as a positive integer.

  • If you create a gmdistribution object by using the gmdistribution function, then the input arguments mu, sigma, and p of gmdistribution set this property.

  • If you fit a gmdistribution object to data by using the fitgmdist function, then the input data X of fitgmdist sets this property.

Data Types: double

This property is read-only.

Flag indicating whether a covariance matrix is shared across mixture components, specified as true or false.

  • If you create a gmdistribution object by using the gmdistribution function, then the type of covariance matrices in the sigma input argument of gmdistribution sets this property.

  • If you fit a gmdistribution object to data by using the fitgmdist function, then the 'SharedCovariance' name-value pair argument of fitgmdist sets this property.

Data Types: logical

Properties for Fitted Object

The following properties apply only to a fitted object you create by using fitgmdist. The values of these properties are empty if you create a gmdistribution object by using the gmdistribution function.

This property is read-only.

Akaike information criterion (AIC), specified as a scalar. AIC = 2*NlogL + 2*p, where NlogL is the negative loglikelihood (the NegativeLogLikelihood property) and p is the number of estimated parameters.

AIC is a model selection tool you can use to compare multiple models fit to the same data. AIC is a likelihood-based measure of model fit that includes a penalty for complexity, specifically, the number of parameters. When you compare multiple models, a model with a smaller value of AIC is better.

This property is empty if you create a gmdistribution object by using the gmdistribution function.

Data Types: single | double

This property is read-only.

Bayes information criterion (BIC), specified as a scalar. BIC = 2*NlogL + p*log(n), where NlogL is the negative loglikelihood (the NegativeLogLikelihood property), n is the number of observations, and p is the number of estimated parameters.

BIC is a model selection tool you can use to compare multiple models fit to the same data. BIC is a likelihood-based measure of model fit that includes a penalty for complexity, specifically, the number of parameters. When you compare multiple models, a model with the lowest BIC value is the best fitting model.

This property is empty if you create a gmdistribution object by using the gmdistribution function.

Data Types: single | double

This property is read-only.

Flag indicating whether the Expectation-Maximization (EM) algorithm is converged when fitting a Gaussian mixture model, specified as true or false.

You can change the optimization options by using the 'Options' name-value pair argument of fitgmdist.

This property is empty if you create a gmdistribution object by using the gmdistribution function.

Data Types: logical

This property is read-only.

Negative loglikelihood of the fitted Gaussian mixture model given the input data X of fitgmdist, specified as a scalar.

This property is empty if you create a gmdistribution object by using the gmdistribution function.

Data Types: single | double

This property is read-only.

Number of iterations in the Expectation-Maximization (EM) algorithm, specified as a positive integer.

You can change the optimization options, including the maximum number of iterations allowed, by using the 'Options' name-value pair argument of fitgmdist.

This property is empty if you create a gmdistribution object by using the gmdistribution function.

Data Types: double

This property is read-only.

Tolerance for posterior probabilities, specified as a nonnegative scalar value in the range [0,1e-6].

The 'ProbabilityTolerance' name-value pair argument of fitgmdist sets this property.

This property is empty if you create a gmdistribution object by using the gmdistribution function.

Data Types: single | double

This property is read-only.

Regularization parameter value, specified as a nonnegative scalar.

The 'RegularizationValue' name-value pair argument of fitgmdist sets this property.

This property is empty if you create a gmdistribution object by using the gmdistribution function.

Data Types: single | double

Object Functions

cdfCumulative distribution function for Gaussian mixture distribution
clusterConstruct clusters from Gaussian mixture distribution
mahalMahalanobis distance to Gaussian mixture component
pdfProbability density function for Gaussian mixture distribution
posteriorPosterior probability of Gaussian mixture component
randomRandom variate from Gaussian mixture distribution

Examples

collapse all

Create a two-component bivariate Gaussian mixture distribution by using the gmdistribution function.

Define the distribution parameters (means and covariances) of two bivariate Gaussian mixture components.

mu = [1 2;-3 -5];
sigma = cat(3,[2 .5],[1 1]) % 1-by-2-by-2 array
sigma = 
sigma(:,:,1) =

    2.0000    0.5000


sigma(:,:,2) =

     1     1

The cat function concatenates the covariances along the third array dimension. The defined covariance matrices are diagonal matrices. sigma(1,:,i) contains the diagonal elements of the covariance matrix of component i.

Create a gmdistribution object. By default, the gmdistribution function creates an equal proportion mixture.

gm = gmdistribution(mu,sigma)
gm = 

Gaussian mixture distribution with 2 components in 2 dimensions
Component 1:
Mixing proportion: 0.500000
Mean:     1     2

Component 2:
Mixing proportion: 0.500000
Mean:    -3    -5

List the properties of the gm object.

properties(gm)
Properties for class gmdistribution:

    NumVariables
    DistributionName
    NumComponents
    ComponentProportion
    SharedCovariance
    NumIterations
    RegularizationValue
    NegativeLogLikelihood
    CovarianceType
    mu
    Sigma
    AIC
    BIC
    Converged
    ProbabilityTolerance

You can access these properties by using dot notation. For example, access the ComponentProportion property, which represents the mixing proportions of mixture components.

gm.ComponentProportion
ans = 1×2

    0.5000    0.5000

A gmdistribution object has properties that apply only to a fitted object. The fitted object properties are AIC, BIC, Converged, NegativeLogLikelihood, NumIterations, ProbabilityTolerance, and RegularizationValue. The values of the fitted object properties are empty if you create an object by using the gmdistribution function and specifying distribution parameters. For example, access the NegativeLogLikelihood property by using dot notation.

gm.NegativeLogLikelihood
ans =

     []

After you create a gmdistribution object, you can use the object functions. Use cdf and pdf to compute the values of the cumulative distribution function (cdf) and the probability density function (pdf). Use random to generate random vectors. Use cluster, mahal, and posterior for cluster analysis.

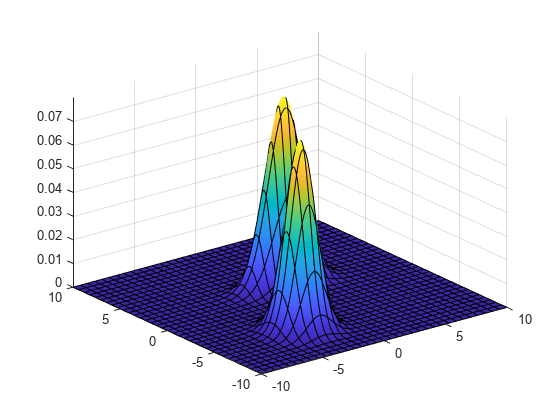
Visualize the object by using pdf and fsurf.

gmPDF = @(x,y) arrayfun(@(x0,y0) pdf(gm,[x0 y0]),x,y);
fsurf(gmPDF,[-10 10])

Figure contains an axes object. The axes object contains an object of type functionsurface.

Generate random variates that follow a mixture of two bivariate Gaussian distributions by using the mvnrnd function. Fit a Gaussian mixture model (GMM) to the generated data by using the fitgmdist function.

Define the distribution parameters (means and covariances) of two bivariate Gaussian mixture components.

mu1 = [1 2];          % Mean of the 1st component
sigma1 = [2 0; 0 .5]; % Covariance of the 1st component
mu2 = [-3 -5];        % Mean of the 2nd component
sigma2 = [1 0; 0 1];  % Covariance of the 2nd component

Generate an equal number of random variates from each component, and combine the two sets of random variates.

rng('default') % For reproducibility
r1 = mvnrnd(mu1,sigma1,1000);
r2 = mvnrnd(mu2,sigma2,1000);
X = [r1; r2];

The combined data set X contains random variates following a mixture of two bivariate Gaussian distributions.

Fit a two-component GMM to X.

gm = fitgmdist(X,2)
gm = 

Gaussian mixture distribution with 2 components in 2 dimensions
Component 1:
Mixing proportion: 0.500000
Mean:   -2.9617   -4.9727

Component 2:
Mixing proportion: 0.500000
Mean:    0.9539    2.0261

List the properties of the gm object.

properties(gm)
Properties for class gmdistribution:

    NumVariables
    DistributionName
    NumComponents
    ComponentProportion
    SharedCovariance
    NumIterations
    RegularizationValue
    NegativeLogLikelihood
    CovarianceType
    mu
    Sigma
    AIC
    BIC
    Converged
    ProbabilityTolerance

You can access these properties by using dot notation. For example, access the NegativeLogLikelihood property, which represents the negative loglikelihood of the data X given the fitted model.

gm.NegativeLogLikelihood
ans = 7.0584e+03

After you create a gmdistribution object, you can use the object functions. Use cdf and pdf to compute the values of the cumulative distribution function (cdf) and the probability density function (pdf). Use random to generate random variates. Use cluster, mahal, and posterior for cluster analysis.

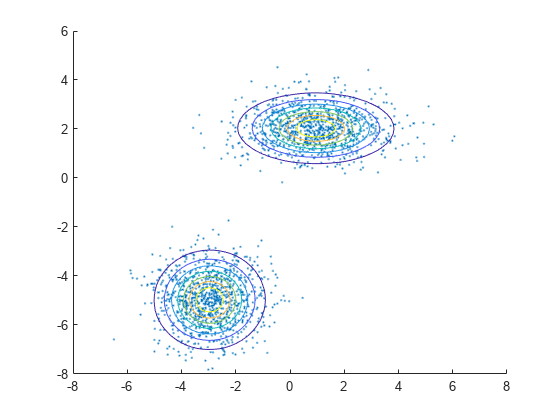
Plot X by using scatter. Visualize the fitted model gm by using pdf and fcontour.

scatter(X(:,1),X(:,2),10,'.') % Scatter plot with points of size 10
hold on
gmPDF = @(x,y) arrayfun(@(x0,y0) pdf(gm,[x0 y0]),x,y);
fcontour(gmPDF,[-8 6])

Figure contains an axes object. The axes object contains 2 objects of type scatter, functioncontour.

References

[1] McLachlan, G., and D. Peel. Finite Mixture Models. Hoboken, NJ: John Wiley & Sons, Inc., 2000.

Version History

Introduced in R2007b